
Penticton weather at a glance
The figures below are Environment Canada climate normals for 1991 to 2020 at the Penticton station, which stands at 344 m above sea level. Daily maximum and minimum are averages of the daily highs and lows, not records. Precipitation is the total for the month, with snow counted as its water equivalent, not just rain. They describe a typical year, not the weather of a day in 2026.
Pick the month by what you want to do: beach days in July and August, walking and cycling in May, June or September, and short winter days. For plans in each season, see Penticton wine tours, things to do in Penticton and Skaha Lake.
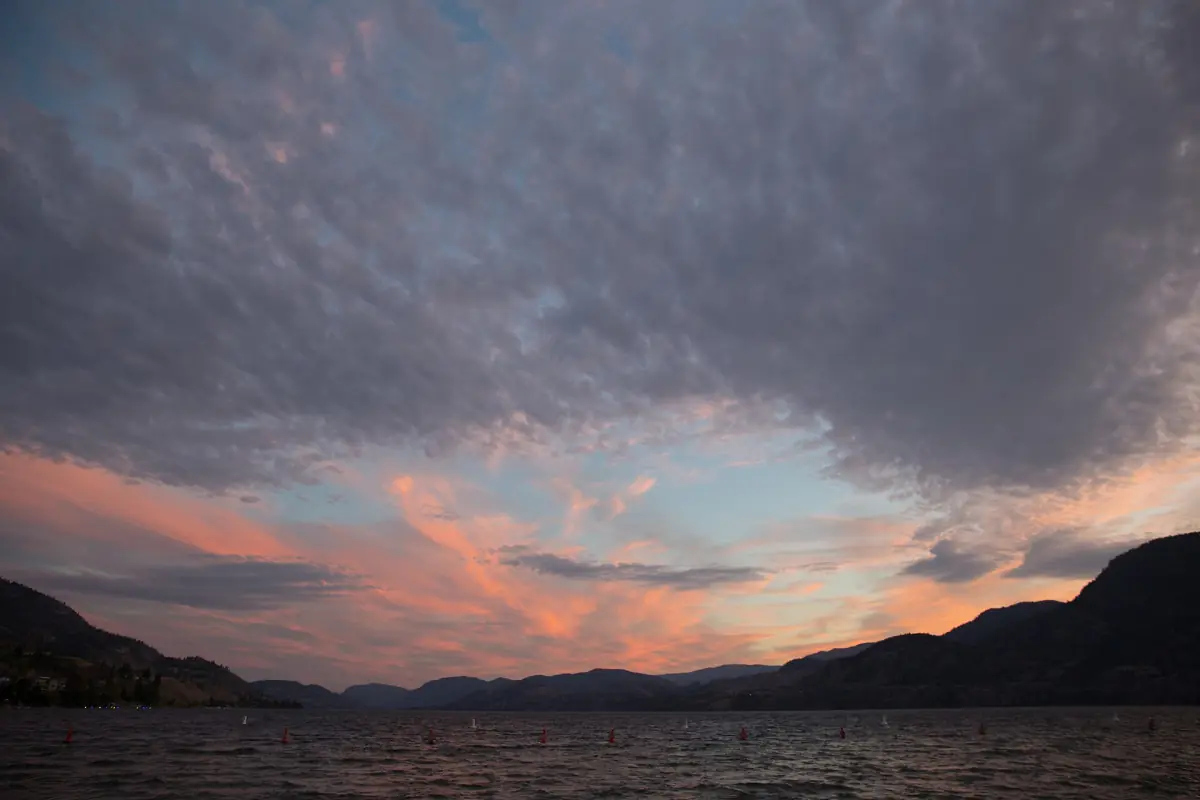
Penticton weather by month
Averages for 1991 to 2020.
| Month | High (°C) | Low (°C) | Precipitation (mm) |
|---|---|---|---|
| January | 1.6 | −3.2 | 28.1 |
| February | 4.6 | −3.1 | 19.3 |
| March | 10.2 | −0.6 | 22.7 |
| April | 15.7 | 2.4 | 25.6 |
| May | 21.4 | 7.1 | 38.2 |
| June | 24.6 | 10.6 | 43.8 |
| July | 29.2 | 13.5 | 28.3 |
| August | 28.4 | 12.8 | 27.0 |
| September | 22.6 | 8.5 | 24.5 |
| October | 14.3 | 3.5 | 28.9 |
| November | 6.7 | 0.0 | 28.1 |
| December | 2.1 | −2.8 | 29.6 |
For most visitors who want warm weather without the peak heat, May, June and September are a good fit. For beach days, choose July or August.
Our pick: a half day in an air-conditioned vehicle
On a hot summer day, a short tasting tour in the south of the valley keeps you out of the midday sun.
Hand-picked tours, booked through Viator. Prices are indicative starting prices in US dollars (as of October 2026). Tap a tour for live availability and the current price in your currency.
Penticton tours and day trips
Wine tours, lake activities and day trips around Penticton in any season, with live prices and availability.
Best time to visit Penticton
What each season means for your plans.
Spring: April to June
Highs rise from 15.7 °C in April to 24.6 °C in June. April and May are the bloom season for the Japanese garden. The Saturday Farmers' Market starts in mid-April.
Summer: July and August
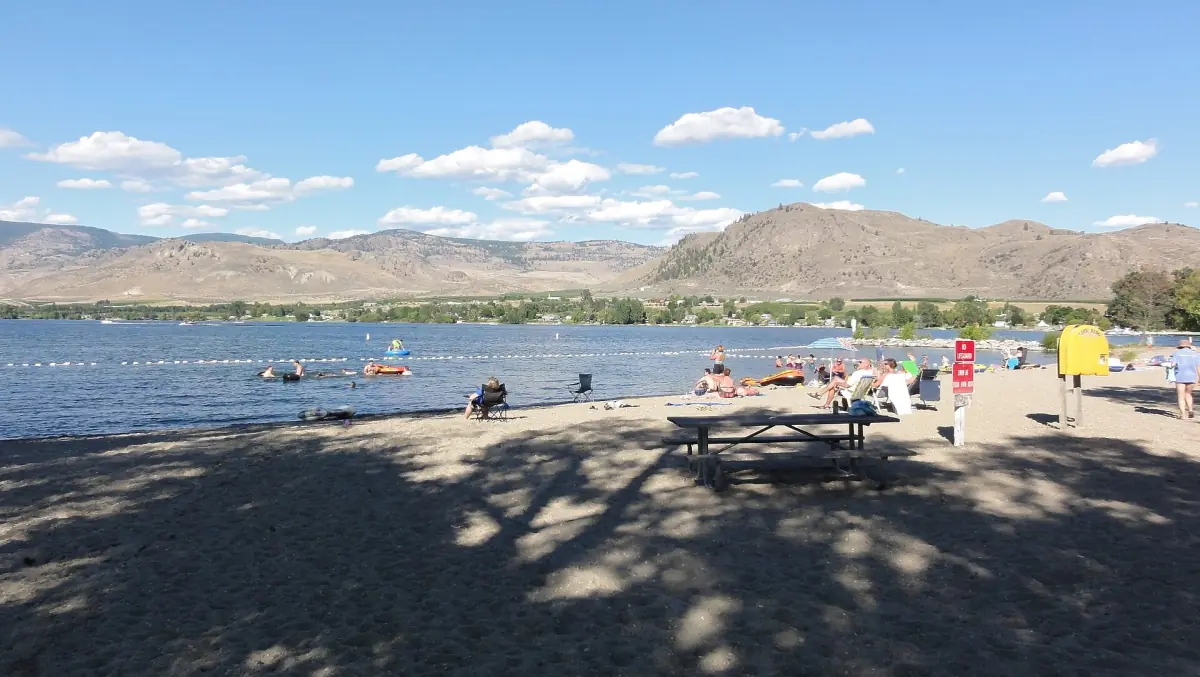
These are the warmest months, with average highs of 29.2 °C and 28.4 °C. They suit the beaches, the River Channel float and swimming. Wildfire smoke can affect summer travel, so read the next section.
Autumn: September and October
September still reaches 22.6 °C on average. By October the high falls to 14.3 °C. Some seasonal services wind down, such as the steam railway in Summerland, which ends its regular 2026 season on 12 October.
Winter: November to March
Highs run from 1.6 °C to 10.2 °C, with lows below freezing from December to March. The gate to Skaha Bluffs is usually closed from mid-November to mid-March.
Wildfire smoke and summer planning
Wildfire smoke can appear in summer, and no period is reliably free of it. Before a summer trip, check the BC Wildfire Service for warnings and DriveBC for road closures. Smoke can also affect air quality indoors and outdoors, and some attractions change plans when air quality is poor.
Wildfire closures can last well after the fire. In 2026, some trails and a road near Summerland were closed after a fire, so confirm your route on the day. Read more on the Summerland page.
Lake and water temperatures
Air temperatures are not water temperatures. For orientation, Osoyoos Lake averages 24 °C in July and August. That figure applies to that lake only.
Plan the rest of your trip
Pages that depend on the season.

Penticton weather: frequently asked questions
What is the warmest month in Penticton?
July, with an average high of 29.2 °C and an average low of 13.5 °C. August follows with a high of 28.4 °C.
What is the coldest month in Penticton?
January, with an average high of 1.6 °C and a low of −3.2 °C.
When is the best time to visit Penticton?
It depends on the plan. July and August are warmest for the beaches. May, June and September suit walking and cycling. No month is guaranteed to be free of wildfire smoke.
Does it rain a lot in Penticton?
Monthly precipitation ranges from 19.3 mm in February to 43.8 mm in June. These totals include snow as water equivalent.
Where do these weather numbers come from?
They are Environment Canada climate normals for 1991 to 2020 at the Penticton station. They show a typical year, not a forecast.